How Community Heart & Soul Works
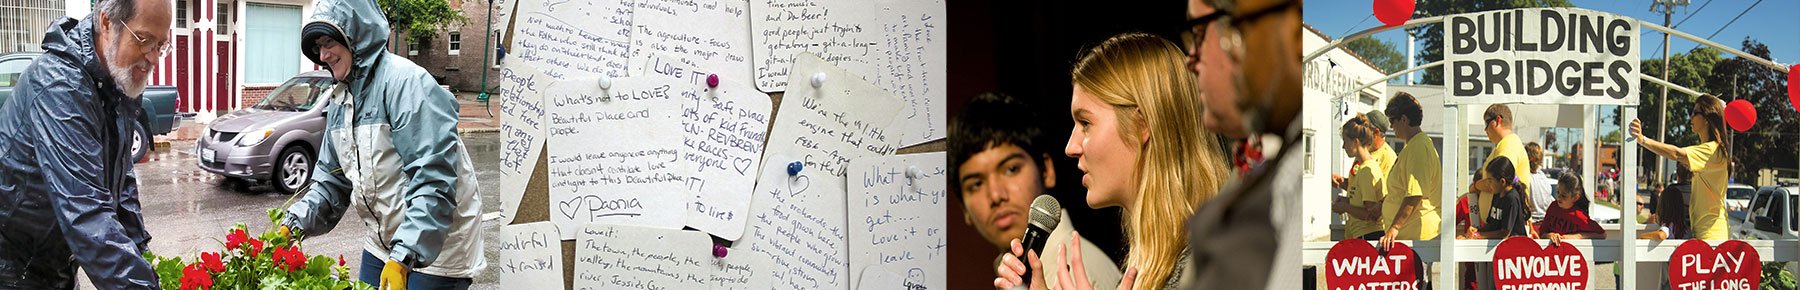
Based on three powerful principles—involve everyone, focus on what matters most, and play the long game, Community Heart & Soul is a four-phase, step-by-step process that brings residents together to identify and honor the unique character of their town and the emotional connection of the people who live there. For most communities, completing the four phases takes about two years. But the completion of the Community Heart & Soul model is really just the beginning. It launches a new way of doing business that nurtures a more vibrant community far into the future.
Our 4 Phase Process
Phase 1: Imagine
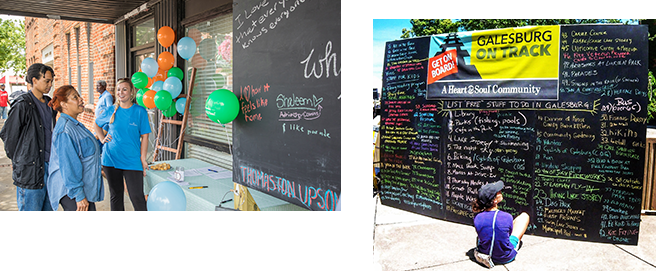
Heart & Soul teams are formed to build awareness, interest, and commitment in all segments of the community.
Phase 2: Connect
Stories are gathered from residents, leading to the development of Heart & Soul Statements that identify what matters most and reflect what they love about their towns.
Phase 3: Plan
Residents develop action plans to guide future town planning based on their Heart & Soul Statements.
Phase 4: Act
Heart & Soul Statements are officially adopted by town and city councils, incorporated into comprehensive and other plans, and are used to guide future policies and decisions.
Community Heart & Soul Basics
Get stories, news, and information about how Community Heart & Soul is creating positive change in communities.
"*" indicates required fields